PDF 原檔:20260612_JPM_Asian MLCC Industry_original.pdf
原始內容
Asian MLCC Industry
Introducing our long-term S&D model with a multi-year bullish view; prefer JP/TW names over KR
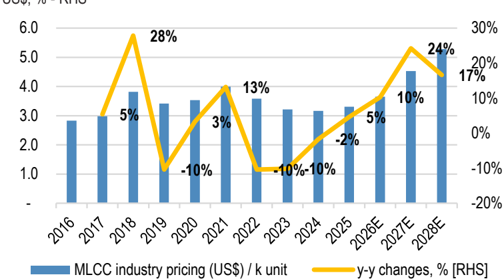
- We introduce our MLCC S-D model which predicts a supply shortage view through 2028E. Our Global MLCC S-D model includes historical updates and a forward three-year outlook. We forecast S-D shortage mainly propelled by server compute demand growth and unique capacity constraint factors. We expect the degree of tightness in the 26-28E cycle (from 10% oversupply in 25 to 6% shortage by 28E) to be slightly worse than that of the 201718 cycle (leading supplier's end-of-life program led a procurement demand spike amid first cloud capex and then first-gen EV demand take-off cycle) and estimate high-50% ASP growth during the same period (similar range of growth to that of the 2016-18 cycle).
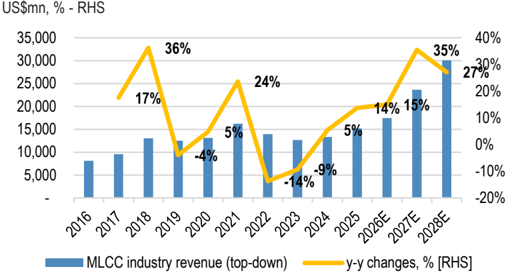
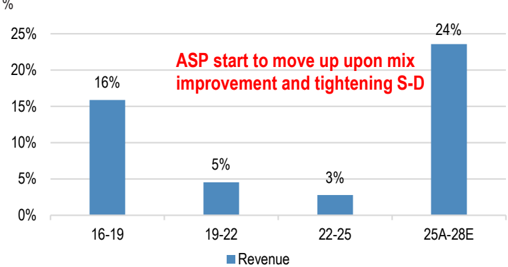
- Server compute drivers' TAM expansion. Server is the single most important application in the MLCC industry which has seen a sharp surge in customer capacity allocation requests (both AI and GP server demand) and we have also seen relatively resilient automotive MLCC demand. While consumer electronics' end demand remains challenging, procurement activities are slightly different as customers (incl. distributor channels) will start to notice a tightening of supply. We forecast the MLCC industry TAM to be above US $30bn (2025-28E CAGR of 24% vs. '2016-19 CAGR of +16%) with a larger impact from the ASP uptick. As a result, we estimate a higher margin profile in coming years (industry OPM at 38% in 2028E vs. 36% in '18), consistent with other commodity tech sectors (e.g. memory, substrate and others).
- Higher capacity trade loss ratio from server/auto mix increase and yield challenge is an underappreciated point. MLCC industry nameplate capacity has historically grown ~10% in the past ten years; however, effective capacity (after production penalty and yield adjustment) indicates considerably limited supply output versus growing procurement demand. Auto and Server MLCC are mainly designed based on larger form-factor vs. IT applications, and higher system power voltage requirements lead to the use of advanced specs. Furthermore, we have seen a sharp rise in new MLCC specs with ultra-high capacitance (e.g. 1005-47uf) for AI server applications (on the back of rising interest from both leading GPU and ASIC camp customers) resulting in a declining assembly yield in the leading supplier's capacity. Such capacity penalties (or trade losses) are accelerating this year (DD% negative impact on headline capacity growth in the next three years vs. low-to-mid single-digit % impact in the past five years), and is not fully understood by investors, in our view.
- Investment recommendations - JP/TW over KR on valuation merit . MLCC suppliers have collectively delivered a 268% 2026 YTD return (vs. MXAP +16%) well outperforming the rest of the technology hardware subsector, and its aggregate market cap stands at US$354bn trading at 61x/40x/30x FY26-28E on consensus EPS. Given the early stage of the industry transition towards the AI ecosystem, we believe consensus earnings revisions tend to lag and expect investors to focus on the growth momentum. That said, share price momentum may remain strong in 2H26E and we stay
Technology - Semiconductors
Jay Kwon AC
(82-2) 758-5725
jay.h.kwon@jpmorgan.com
J.P. Morgan Securities (Far East) Limited, Seoul Branch
Akinori Kanemoto AC
(81-3) 6736 8628 akinori.kanemoto@jpmorgan.com
JPMorgan Securities Japan Co., Ltd.
Jerry Tsai AC
(886-2) 2725-9867 jerry.tsai@jpmorgan.com J.P. Morgan Securities (Taiwan) Limited
Sangsik Lee
(82-2) 758 5146
sangsik.lee@jpmorgan.com
J.P. Morgan Securities (Far East) Limited, Seoul Branch
Neelay Y Kamath
(91-22) 6157 3764 neelay.kamath@jpmchase.com J.P. Morgan India Private Limited
constructive on the sector's growth prospects. We have an OW view on all major MLCC players in Asia and believe Japan ( Murata > Taiyo Yuden > TDK ) and Taiwan ( Yageo ) peers present greater upside over their Korean peers ( SEMCO ) due to attractive valuation.
- Key risks and catalysts . AI server-grade MLCC (using side-gap construction method) is a relatively new SKU in the industry and we are seeing meaningful R&D activity pick up to accommodate higher power requirements for next-generation server systems. As discussed earlier, assembly yield tends to be 3-6x lower than that of normal MLCC and there are only a few selective suppliers who can scale up to meaningful volumes. This is likely to limit the production output for a considerable period and end customers' procurement appetite could be substantially higher regardless of price point. This remains a key upside risk point to the pricing and margin profile for AI MLCC and the spillover effect to IT and commodity segment will be a key monitoring point. We will closely follow suppliers' production and capacity-related commentary to assess the realistic supply increase and consequent S-D situation. Secondary market pricing has traditionally been a leading indicator of contract pricing sentiment and we will closely follow the trends.
Figure 1: MLCC industry revenue and y-y
Source: J.P. Morgan estimates, Company data.
Figure 3: MLCC industry pricing and y-y
US$, % - RHS
Source: J.P. Morgan estimates, Company data.
Figure 5: MLCC industry revenue vs volume CAGR comparison
Source: J.P. Morgan estimates, Company data.
Key charts and tables
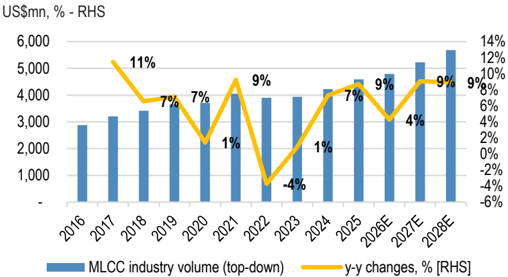
Figure 2: MLCC industry volume and y-y
Source: J.P. Morgan estimates, Company data.
Figure 4: MLCC Revenue and OPM trend for the top 5 players
US$bn, % - RHS
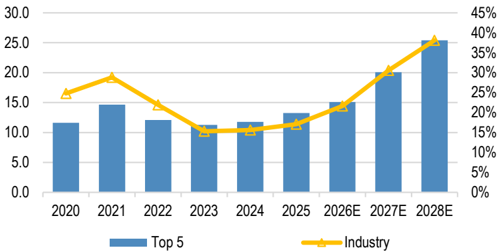
Source: J.P. Morgan estimates, Company data.
Figure 6: MLCC content comparison by application
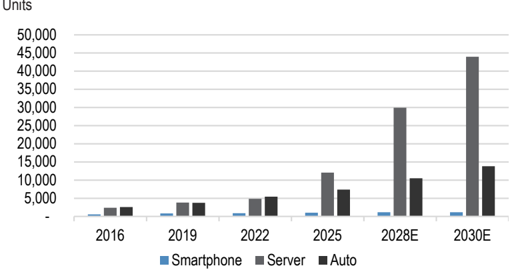
Source: J.P. Morgan estimates, Company data.
Figure 7: MLCC content comparison by application for 2025E
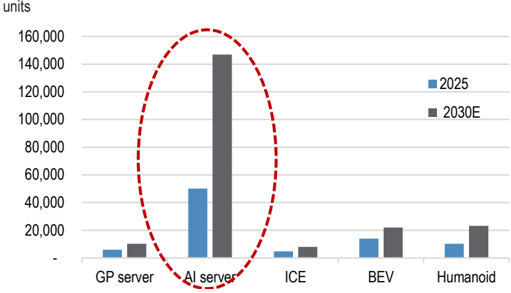
Source: J.P. Morgan estimates, Company data.
Figure 9: MLCC player's UTR trend
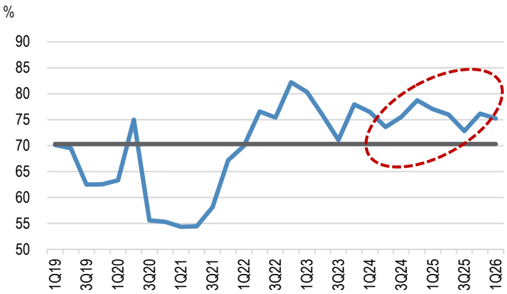
Source: J.P. Morgan estimates, Company data.
Figure 11: Long Term MLCC Supply-Procurement Gap trend
US$mn, % - RHS
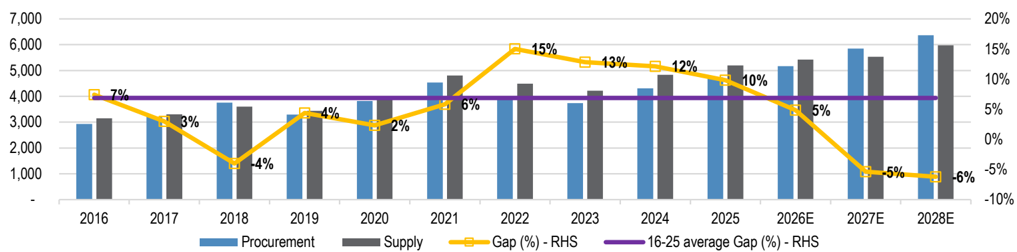
Source: J.P. Morgan estimates, Company data.
Figure 8: MLCC industry bottoms-up OPM trend
%
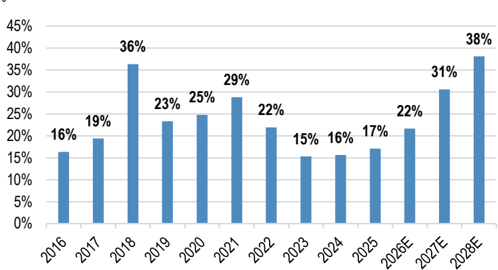
Source: J.P. Morgan estimates, Company data.
Figure 10: MLCC players' inventory days outstanding
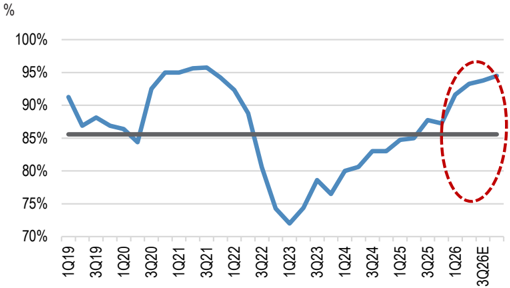
Source: J.P. Morgan estimates, Company data.
Table 1: MLCC industry demand forecast
Units in billions
| Unit in billions | 2016 | 2017 | 2018 | 2019 | 2020 | 2021 | 2022 | 2023 | 2024 | 2025 | 2026E | 2027E | 2028E | 2029E | 2030E |
|---|---|---|---|---|---|---|---|---|---|---|---|---|---|---|---|
| MLCC demand | 2,875 | 3,205 | 3,415 | 3,658 | 3,710 | 4,053 | 3,902 | 3,937 | 4,224 | 4,593 | 4,789 | 5,222 | 5,688 | 6,283 | 6,898 |
| y/y changes,% | 11% | 7% | 7% | 1% | 9% | -4% | 1% | 7% | 9% | 4% | 9% | 9% | 10% | 10% | |
| Mobile | 1,132 | 1,288 | 1,329 | 1,390 | 1,341 | 1,483 | 1,406 | 1,374 | 1,465 | 1,568 | 1,485 | 1,478 | 1,503 | 1,557 | 1,600 |
| Smartphone | 897 | 1,060 | 1,105 | 1,136 | 1,058 | 1,178 | 1,111 | 1,094 | 1,167 | 1,254 | 1,179 | 1,177 | 1,194 | 1,233 | 1,265 |
| Low-end | 252 | 288 | 316 | 317 | 297 | 281 | 246 | 281 | 333 | 334 | 280 | 273 | 279 | 290 | 298 |
| Mid-end | 305 | 396 | 393 | 436 | 372 | 441 | 410 | 357 | 358 | 394 | 384 | 384 | 389 | 400 | 412 |
| High-end | 339 | 376 | 397 | 382 | 389 | 457 | 455 | 456 | 475 | 526 | 515 | 519 | 526 | 542 | 556 |
| Tablets | 127 | 125 | 109 | 117 | 141 | 140 | 124 | 114 | 126 | 129 | 122 | 117 | 117 | 122 | 127 |
| Featurephone | 94 | 81 | 80 | 74 | 65 | 67 | 64 | 57 | 54 | 57 | 54 | 55 | 57 | 60 | 61 |
| Others | 15 | 24 | 34 | 64 | 77 | 98 | 107 | 109 | 119 | 128 | 130 | 130 | 135 | 142 | 146 |
| PC/Server | 296 | 336 | 376 | 401 | 442 | 520 | 484 | 430 | 474 | 592 | 711 | 957 | 1,199 | 1,453 | 1,717 |
| Desktop | 130 | 143 | 155 | 165 | 140 | 158 | 148 | 126 | 128 | 148 | 147 | 157 | 176 | 188 | 198 |
| NBPC | 130 | 144 | 160 | 170 | 215 | 265 | 245 | 220 | 236 | 273 | 277 | 310 | 363 | 384 | 405 |
| Chromebook | 7 | 11 | 14 | 16 | 33 | 38 | 22 | 20 | 22 | 23 | 23 | 25 | 30 | 33 | 37 |
| Server | 27 | 35 | 45 | 48 | 52 | 57 | 67 | 63 | 87 | 148 | 264 | 463 | 629 | 847 | 1,077 |
| GP server | 27 | 35 | 45 | 48 | 52 | 57 | 65 | 54 | 60 | 64 | 90 | 119 | 142 | 167 | 189 |
| AI server | - | - | - | - | - | - | 2 | 8 | 27 | 84 | 174 | 345 | 487 | 680 | 888 |
| Others | 3 | 3 | 2 | 2 | 1 | 1 | 1 | 1 | 1 | 1 | 1 | 1 | 1 | 1 | 1 |
| Consumer | 811 | 848 | 900 | 955 | 985 | 993 | 991 | 1,000 | 1,043 | 1,077 | 1,099 | 1,122 | 1,153 | 1,184 | 1,230 |
| TV | 444 | 452 | 476 | 490 | 503 | 491 | 478 | 484 | 502 | 511 | 517 | 533 | 543 | 554 | 564 |
| Appliance | 344 | 375 | 401 | 443 | 461 | 480 | 491 | 495 | 519 | 543 | 558 | 564 | 584 | 605 | 640 |
| Others | 22 | 21 | 23 | 22 | 22 | 22 | 21 | 22 | 22 | 23 | 24 | 25 | 25 | 26 | 27 |
| Automotive | 237 | 273 | 311 | 333 | 322 | 377 | 421 | 513 | 582 | 656 | 734 | 841 | 962 | 1,118 | 1,277 |
| ICE | 223 | 252 | 278 | 287 | 254 | 257 | 246 | 269 | 259 | 247 | 239 | 245 | 249 | 270 | 286 |
| HEV | 9 | 11 | 14 | 24 | 34 | 49 | 63 | 87 | 111 | 136 | 163 | 188 | 234 | 281 | 320 |
| PHEV | 2 | 3 | 5 | 5 | 9 | 18 | 27 | 41 | 69 | 85 | 103 | 121 | 137 | 158 | 187 |
| EV | 4 | 7 | 13 | 16 | 24 | 53 | 85 | 116 | 142 | 188 | 229 | 287 | 342 | 410 | 484 |
| Industrial/Others | 400 | 460 | 500 | 580 | 620 | 680 | 600 | 620 | 660 | 700 | 761 | 824 | 871 | 970 | 1,073 |
| Industrial | 400 | 460 | 500 | 580 | 620 | 680 | 600 | 620 | 660 | 700 | 760 | 820 | 860 | 930 | 980 |
| Crypto currency Robotics (Humanoid) Military/Civil/Others | 0 | 0 | 1 | 4 | 11 | 40 | 93 | ||||||||
| Auto as %of total MLCC | 8.2% | 8.5% | 9.1% | 9.1% | 8.7% | 9.3% | 10.8% | 13.0% | 13.8% | 14.3% | 15.3% | 16.1% | 16.9% | 17.8% | 18.5% |
| EV as %of total MLCC | 0.1% | 0.2% | 0.4% | 0.4% | 0.6% | 1.3% | 2.2% | 2.9% | 3.4% | 4.1% | 4.8% | 5.5% | 6.0% | 6.5% | 7.0% |
| Server as %of total MLCC | 0.9% | 1.1% | 1.3% | 1.3% | 1.4% | 1.4% | 1.7% | 1.6% | 2.1% | 3.2% | 5.5% | 8.9% | 11.1% | 13.5% | 15.6% |
| Humanoid as %of total MLCC | 10.4% | 10.7% | 12.5% | 0.0% | 0.0% | 0.0% | 0.1% | 0.2% 28.2% | 0.6% | 1.3% | |||||
| Auto + Server + Humanoid | 9.2% | 9.6% | 10.4% | 10.1% | 14.6% | 15.8% | 17.5% | 20.8% | 25.1% | 31.9% | 35.5% | ||||
| Supply mix of three segment | 22.9% | 24.0% | 26.0% | 26.0% | 24.2% | 25.2% | 28.8% | 33.6% | 36.4% | 41.2% | 52.1% | 65.1% | 74.6% | 84.6% | 95.8% |
| y-y mix changes,% | 1.1% | 2.0% | -0.1% | -1.8% | 1.0% | 3.6% | 4.8% | 2.8% | 4.7% | 10.9% | 13.0% | 9.5% | 10.0% | 11.2% |
Source: J.P. Morgan estimates, Company data.
Table 2: MLCC industry end-system unit forecast
Units in mn
| 2016 | 2017 | 2018 | 2019 | 2020 | 2021 | 2022 | 2023 | 2024 | 2025 | 2026E | 2027E | 2028E | 2029E | 2030E | |
|---|---|---|---|---|---|---|---|---|---|---|---|---|---|---|---|
| End demand Mobile | 5,724 2,139 | 5,792 2,096 | 5,817 2,024 | 5,870 1,994 | 5,834 1,926 | 5,973 2,014 | 5,734 1,866 | 5,537 1,777 | 5,679 1,853 | 5,781 1,880 | 5,589 1,704 | 5,502 1,655 | 5,540 1,647 | 5,591 1,662 | 5,714 1,675 |
| Smartphone | 1,502 | 1,547 | 1,496 | 1,387 | 1,295 | 1,340 | 1,207 | 1,165 | 1,223 | 1,239 | 1,097 | 1,064 | 1,054 | 1,060 | 1,066 |
| Low-end | 623 | 605 | 602 | 573 | 513 | 454 | 381 | 417 | 479 | 458 | 368 | 351 | 348 | 350 | 352 |
| Mid-end | 502 | 566 | 516 | 541 | 443 | 502 | 453 | 386 | 375 | 388 | 362 | 351 | 348 | 350 | 352 |
| High-end | 377 | 376 | 378 | 354 | 339 | 384 | 373 | 362 | 369 | 392 | 368 | 362 | 358 | 360 | 362 |
| Tablets | 170 | 156 | 129 | 130 | 149 | 144 | 124 | 112 | 120 | 120 | 108 | 102 | 100 | 102 | 104 |
| Featurephone | 387 | 283 | 255 | 223 | 187 | 180 | 165 | 140 | 129 | 131 | 118 | 119 | 119 | 120 | 120 |
| Others | 80 | 110 | 145 | 255 | 295 | 350 | 370 | 360 | 380 | 390 | 380 | 370 | 375 | 380 | 385 |
| PC/Server | 301 | 297 | 297 | 300 | 329 | 362 | 304 | 259 | 266 | 285 | 259 | 263 | 280 | 286 | 291 |
| Desktop | 108 | 102 | 100 | 100 | 80 | 85 | 76 | 62 | 61 | 67 | 59 | 58 | 62 | 63 | 64 |
| NBPC | 162 | 160 | 160 | 162 | 196 | 221 | 189 | 163 | 168 | 182 | 163 | 163 | 173 | 174 | 176 |
| Chromebook | 9 | 13 | 15 | 16 | 33 | 35 | 19 | 17 | 18 | 18 | 16 | 17 | 18 | 19 | 21 |
| Server | 11.1 | 11.5 | 13.0 | 12.5 | 12.7 | 12.9 | 13.8 | 11.3 | 12.1 | 12.3 | 15.6 | 18.9 | 21.0 | 22.9 | 24.5 |
| GP server | 11.1 | 11.5 | 13.0 | 12.5 | 12.7 | 12.9 | 13.6 | 10.5 | 10.8 | 10.6 | 12.6 | 14.7 | 16.1 | 17.4 | 18.5 |
| AI server | - | - | - | - | - | - | 0.2 | 0.8 | 1.3 | 1.7 | 2.9 | 4.3 | 4.9 | 5.5 | 6.0 |
| Others | 10 | 10 | 10 | 9 | 8 | 7 | 7 | 6 | 6 | 6 | 6 | 6 | 6 | 6 | 7 |
| Consumer | 3,011 | 3,131 | 3,226 | 3,306 | 3,323 | 3,337 | 3,301 | 3,228 | 3,281 | 3,330 | 3,329 | 3,281 | 3,306 | 3,331 | 3,431 |
| TV | 222 | 215 | 221 | 223 | 224 | 214 | 204 | 202 | 205 | 204 | 203 | 205 | 205 | 205 | 205 |
| Appliance | 2,750 | 2,882 | 2,971 | 3,052 | 3,070 | 3,095 | 3,071 | 3,000 | 3,050 | 3,100 | 3,100 | 3,050 | 3,075 | 3,100 | 3,200 |
| Others | 39 | 33 | 33 | 31 | 29 | 28 | 27 | 26 | 26 | 26 | 26 | 26 | 26 | 26 | 26 |
| Automotive | 92 | 93 | 92 | 88 | 76 | 78 | 77 | 86 | 88 | 89 | 90 | 91 | 92 | 92 | 93 |
| ICE | 89 | 90 | 87 | 82 | 67 | 64 | 59 | 61 | 56 | 51 | 48 | 45 | 41 | 39 | 36 |
| HEV | 2 | 2 | 3 | 4 | 5 | 7 | 9 | 11 | 14 | 16 | 18 | 20 | 21 | 22 | 24 |
| PHEV | 0 | 0 | 1 | 1 | 1 | 2 | 3 | 4 | 7 | 8 | 9 | 9 | 10 | 11 | 11 |
| EV | 0 | 1 | 1 | 2 | 2 | 5 | 7 | 9 | 11 | 13 | 15 | 17 | 19 | 21 | 22 |
| Industrial/Others | 182 | 175 | 178 | 181 | 181 | 183 | 185 | 187 | 192 | 197 | 208 | 212 | 216 | 220 | 224 |
Source: J.P. Morgan estimates, Company data.
Table 3: MLCC industry S/D analysis
Units in bn
| MLCC S-D analysis | 2016 | 2017 | 2018 | 2019 | 2020 | 2021 | 2022 | 2023 | 2024 | 2025 | 2026E | 2027E | 2028E | 2029E | 2030E |
|---|---|---|---|---|---|---|---|---|---|---|---|---|---|---|---|
| MLCC industry demand | 2,875 | 3,205 | 3,415 | 3,658 | 3,710 | 4,053 | 3,902 | 3,937 | 4,224 | 4,593 | 4,789 | 5,222 | 5,688 | 6,283 | 6,898 |
| MLCC industry procurement | 2,933 | 3,205 | 3,757 | 3,292 | 3,822 | 4,540 | 3,902 | 3,740 | 4,309 | 4,731 | 5,172 | 5,849 | 6,370 | 7,037 | 7,725 |
| MLCC industry capacity | 3,583 | 3,909 | 4,414 | 4,882 | 5,370 | 6,005 | 6,440 | 7,090 | 7,826 | 8,472 | 9,239 | 10,542 | 12,229 | 14,431 | 17,028 |
| MLCC industry capacity y-y | 280 | 326 | 505 | 468 | 488 | 635 | 435 | 649 | 736 | 646 | 768 | 1,303 | 1,687 | 2,201 | 2,597 |
| Large-size MLCC impact (%) | 0% | -1% | -2% | 0% | 2% | -1% | -4% | -5% | -3% | -5% | -11% | -13% | -10% | -10% | -11% |
| MLCC industry capacity - adjusted | 3,583 | 3,864 | 4,280 | 4,752 | 5,337 | 5,910 | 6,114 | 6,422 | 6,938 | 7,183 | 6,940 | 6,868 | 7,391 | 8,156 | 8,848 |
| MLCC industry utilization (%) | 88% | 95% | 94% | 81% | 82% | 91% | 82% | 73% | 78% | 81% | 88% | 92% | 94% | 95% | 95% |
| MLCC industry yield (%) | 90% | 90% | 90% | 90% | 90% | 90% | 90% | 90% | 90% | 89% | 89% | 87% | 86% | 86% | 86% |
| MLCC industry volume (supply) | 3,150 | 3,301 | 3,606 | 3,436 | 3,911 | 4,804 | 4,488 | 4,220 | 4,831 | 5,195 | 5,423 | 5,534 | 5,975 | 6,664 | 7,229 |
| MLCC industry S-D imbalance | 217 | 96 | (151) | 144 | 89 | 265 | 586 | 479 | 522 | 465 | 252 | (315) | (395) | (373) | (496) |
| MLCC industry S-D (%) | 7% | 3% | -4% | 4% | 2% | 6% | 15% | 13% | 12% | 10% | 5% | -5% | -6% | -5% | -6% |
Source: J.P. Morgan estimates, Company data.
Figure 12: MLCC industry bottom-up revenue and y-y trend US$bn
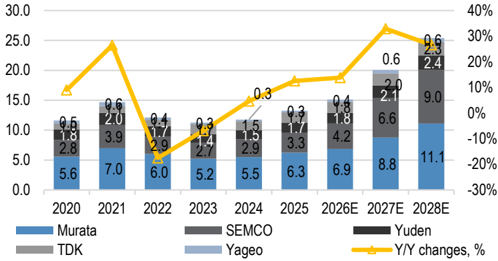
Source: J.P. Morgan estimates, Company data.
Figure 14: MLCC Industry Bottom-up Wallet Share Comparison (Value) %
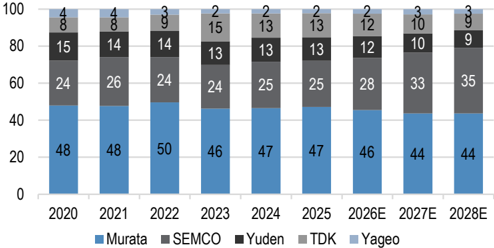
Source: J.P. Morgan estimates, Company data.
Figure 13: MLCC industry bottom-up revenue y-y comparison for individual players
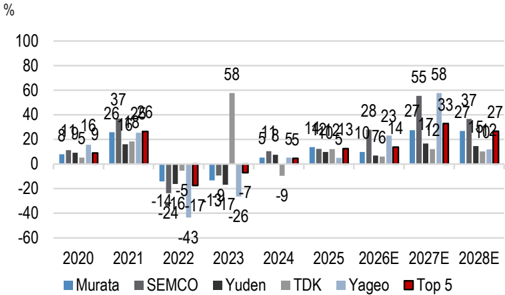
Source: J.P. Morgan estimates, Company data.
Figure 15: MLCC top 5 auto MLCC sales mix (%) and Global auto MLCC unit sales mix (%) comparison
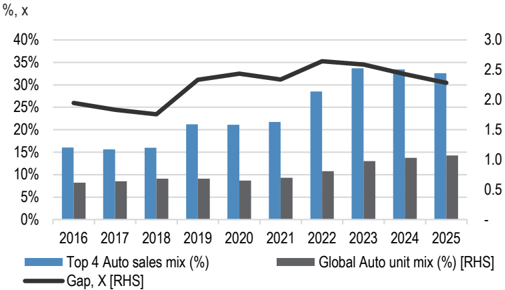
Source: J.P. Morgan estimates, Company data.
Figure 16: OPM comparison between DRAM, NAND, MLCC and Substrate
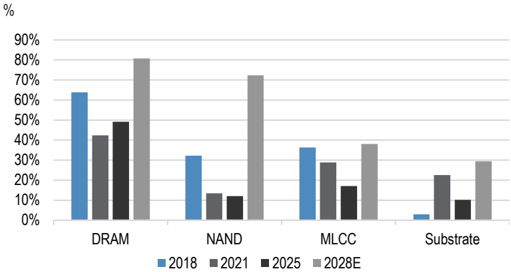
Source: J.P. Morgan estimates, Company data.
Figure 18: OPM comparison between MLCC players (2018 vs 2028E)
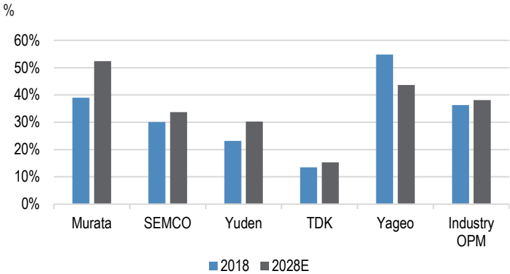
Source: J.P. Morgan estimates, Company data.
Figure 17: Auto sales CAGR by MLCC players (22-25')
%
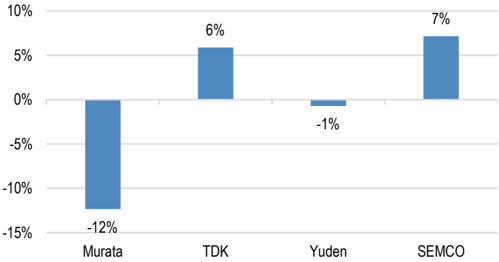
Source: J.P. Morgan estimates, Company data.
Figure 19: MLCC OPM trends by players
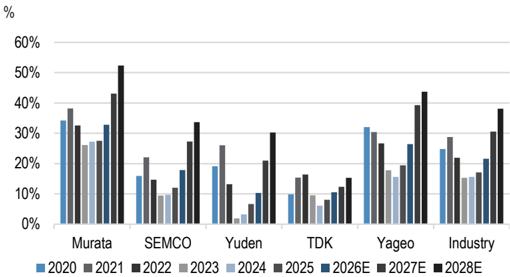
Source: J.P. Morgan estimates, Company data.
Table 4: Auto MLCC peer comparison analysis
Revenue in US$bn
| 2016 | 2017 | 2018 | 2019 | 2020 | 2021 | 2022 | 2023 | 2024 | 2025 | 25A vs. 22 | |
|---|---|---|---|---|---|---|---|---|---|---|---|
| Auto revenue | |||||||||||
| Murata | 0.8 | 0.9 | 1.3 | 1.4 | 1.5 | 2.0 | 2.1 | 2.0 | 2.1 | 2.1 | 0% |
| TDK | 0.2 | 0.2 | 0.3 | 0.4 | 0.4 | 0.5 | 0.5 | 0.8 | 0.7 | 0.8 | 81% |
| Yuden | 0.1 | 0.1 | 0.2 | 0.2 | 0.3 | 0.4 | 0.4 | 0.4 | 0.5 | 0.5 | 18% |
| SEMCO | 0.0 | 0.0 | 0.1 | 0.2 | 0.2 | 0.3 | 0.5 | 0.5 | 0.7 | 0.9 | 91% |
| Sum total | 1.1 | 1.3 | 1.9 | 2.3 | 2.4 | 3.2 | 3.5 | 3.8 | 3.9 | 4.3 | 25% |
| Auto mix,% | |||||||||||
| Murata | 24% | 23% | 25% | 28% | 27% | 28% | 35% | 38% | 37% | 34% | -1% |
| TDK | 32% | 31% | 34% | 42% | 45% | 43% | 42% | 48% | 48% | 48% | 6% |
| Yuden | 8% | 11% | 13% | 13% | 17% | 20% | 26% | 31% | 31% | 31% | 5% |
| SEMCO | 1% | 1% | 5% | 9% | 8% | 8% | 16% | 21% | 23% | 26% | 11% |
| Sum total | 16% | 16% | 16% | 21% | 21% | 22% | 29% | 34% | 33% | 33% | 4% |
| Auto y-y | |||||||||||
| Murata | 13% | 41% | 15% | 4% | 33% | 6% | -5% | 3% | 2% | 0% | |
| TDK | 9% | 29% | 21% | 11% | 14% | -7% | 78% | -10% | 12% | 22% | |
| Yuden | 49% | 55% | 9% | 41% | 37% | 6% | -1% | 8% | 11% | 6% | |
| SEMCO | 87% | 538% | 60% | 2% | 36% | 49% | 20% | 24% | 29% | 24% | |
| Sum total | 16% | 49% | 18% | 8% | 30% | 8% | 10% | 4% | 10% | 8% | |
| Auto share,% | |||||||||||
| Murata | 71% | 69% | 66% | 64% | 61% | 62% | 61% | 53% | 52% | 49% | -12% |
| TDK | 20% | 19% | 17% | 17% | 17% | 15% | 13% | 21% | 19% | 19% | 6% |
| Yuden | 8% | 10% | 10% | 9% | 12% | 13% | 13% | 11% | 12% | 12% | -1% |
| SEMCO | 1% | 2% | 7% | 10% | 9% | 10% | 13% | 14% | 17% | 20% | 7% |
Source: J.P. Morgan estimates, Company data. *note: above is only MLCC revenue specific to automotive applications
Table 6: Peer valuation table
| Market Cap | Market Cap | P/E(x) | P/E(x) | P/E(x) | P/B(x) | P/B(x) | P/B(x) | ROE(%) | ROE(%) | ROE(%) | YTD | 1M | 3M | 6M | |||
|---|---|---|---|---|---|---|---|---|---|---|---|---|---|---|---|---|---|
| Company name | Ticker | Price | ($mn) | FY26E | FY27E | FY28E | FY26E | FY27E | FY27E | FY26E | FY27E | FY28E | Return | Return | Return Return | Return | Return |
| SEMCO | 009150 KS | 1,808,000 | 88,196 | 106.6 | 61.0 | 44.8 | 13.0 | 10.9 | 8.8 | 12.7 | 18.5 | 22.1 | 608.0 | 94.9 | 348.3 | 567.5 | 1276.7 |
| Murata | 6981 JP | 8,967 | 110,062 | 51.9 | 40.7 | 29.8 | 5.8 | 5.2 | 4.6 | 11.3 | 13.7 | 15.7 | 175.4 | 47.1 | 140.3 | 162.9 | 317.9 |
| Taiyo Yuden | 6976 JP | 16,630 | 13,541 | 85.3 | 54.8 | 35.2 | 6.0 | 5.6 | 4.9 | 7.6 | 11.2 | 13.7 | 369.2 | 155.5 | 315.3 | 356.7 | 587.8 |
| TDK | 6762 JP | 3,561 | 43,282 | 29.2 | 25.4 | 21.0 | 3.0 | 2.8 | 2.5 | 10.6 | 11.5 | 12.2 | 62.1 | 21.0 | 64.9 | 53.2 | 132.4 |
| Kyocera | 6971 JP | 3,596 | 31,908 | 36.8 | 33.0 | 25.3 | 1.5 | 1.5 | 1.4 | 4.0 | 4.5 | 5.0 | 68.4 | 29.9 | 43.9 | 64.5 | 116.6 |
| Yageo | 2327 TT | 842 | 55,153 | 46.9 | 32.7 | 24.4 | 8.4 | 7.0 | 5.7 | 19.3 | 23.7 | 27.5 | 281.0 | 109.8 | 249.9 | 270.5 | 622.8 |
| Walsin | 2492 TT | 418 | 6,406 | 55.7 | n.a. | n.a. | n.a. | n.a. | n.a. | n.a. | n.a. | n.a. | 263.2 | 125.5 | 240.0 | 254.2 | 417.0 |
| Vishay | VSH US | 55 | 7,438 | 73.9 | 35.4 | n.a. | 3.8 | 3.7 | n.a. | 5.6 | n.a. | n.a. | 304.4 | 74.2 | 241.7 | 282.3 | 267.4 |
| MLCC Industry | MLCC Industry | MLCC Industry | 355,987 | 60.8 | 40.4 | 30.1 | 5.9 | 5.2 | 4.6 | 10.2 | 13.8 | 13.7 | 266.5 | 82.2 | 205.5 | 251.5 | 467.3 |
Source: Bloomberg Finance L.P. As at 11 June 2026
Figure 20: Past 3M Price Performance - SEMCO vs. MLCC Peers
%
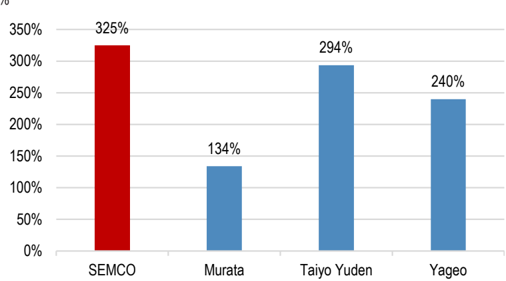
Source: Bloomberg Finance L.P. Note: Past performance is not an indicator of future results.
Table 5: MLCC supplier's sales mix by application comparison
%
| Murata (New) | 2016 | 2017 | 2018 | 2019 | 2020 | 2021 | 2022 | 2023 | 2024 | 2025 |
|---|---|---|---|---|---|---|---|---|---|---|
| Telecom | 34% | 36% | 33% | 36% | 34% | 28% | 27% | 27% | 25% | 22% |
| Mobility | 24% | 23% | 25% | 28% | 27% | 28% | 35% | 38% | 37% | 34% |
| Computers | 19% | 19% | 21% | 22% | 26% | 28% | 18% | 18% | 21% | 25% |
| Home Appliance | 7% | 7% | 5% | 5% | 6% | 5% | 5% | 5% | 5% | 5% |
| Industrial & others | 16% | 16% | 15% | 9% | 7% | 11% | 15% | 12% | 12% | 15% |
| Yuden | 2016 | 2017 | 2018 | 2019 | 2020 | 2021 | 2022 | 2023 | 2024 | 2025 |
| PC | 22% | 19% | 19% | 19% | 19% | 19% | 18% | 16% | 19% | 17% |
| Mobile | 37% | 35% | 32% | 33% | 28% | 25% | 19% | 25% | 20% | 17% |
| Consumer | 10% | 11% | 10% | 8% | 9% | 9% | 9% | 8% | 8% | 7% |
| Auto | 8% | 11% | 13% | 13% | 17% | 20% | 26% | 31% | 31% | 31% |
| Industria/others | 24% | 24% | 26% | 27% | 27% | 27% | 28% | 20% | 22% | 29% |
| SEMCO | 2016 | 2017 | 2018 | 2019 | 2020 | 2021 | 2022 | 2023 | 2024 | 2025 |
| IT | 64% | 63% | 61% | 54% | 55% | 57% | 53% | 49% | 49% | 48% |
| Industrial | 10% | 13% | 15% | 20% | 22% | 21% | 18% | 19% | 19% | 20% |
| Auto | 1% | 1% | 5% | 9% | 8% | 8% | 16% | 21% | 23% | 27% |
| Commodity | 25% | 23% | 19% | 17% | 15% | 14% | 13% | 12% | 9% | 5% |
| Yageo | 2016 | 2017 | 2018 | 2019 | 2020 | 2021 | 2022 | 2023 | 2024 | 2025 |
| Consumer | 10% | 9% | 10% | 6% | 5% | 5% | 6% | 6% | 11% | 12% |
| Mobile | 24% | 27% | 24% | 24% | 18% | 18% | 16% | 14% | 9% | 10% |
| PC | 41% | 24% | 25% | 24% | 25% | 25% | 22% | 18% | 26% | 26% |
| Auto | 6% | 10% | 11% | 15% | 16% | 16% | 21% | 24% | 18% | 19% |
| Industrial/Others | 19% | 30% | 30% | 31% | 36% | 36% | 30% | 38% | 36% | 33% |
Source: J.P. Morgan estimates, Company data.
Share Price Outlook and Valuation
chg pct ytd chg pct 1m
chg pct 3m chg pct 6m
chg pct 1yr
Figure 21: Past 12M Price Performance - SEMCO vs. MLCC Peers
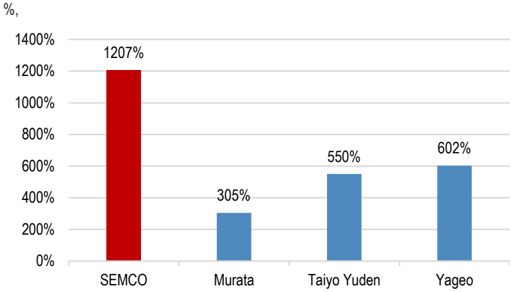
Source: Bloomberg Finance L.P. Note: Past performance is not an indicator of future results.
Figure 22: FTM P/B for MLCC peers over the past 15 years
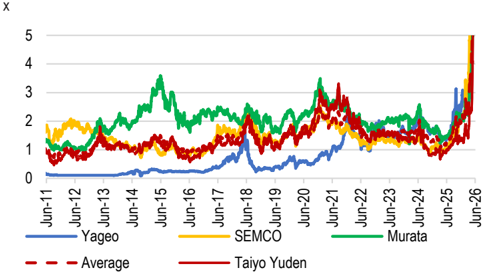
Source: Bloomberg Finance L.P. Note: Past performance is not an indicator of future results.
Figure 23: Average FTM P/B for MLCC peers over the past 15 years
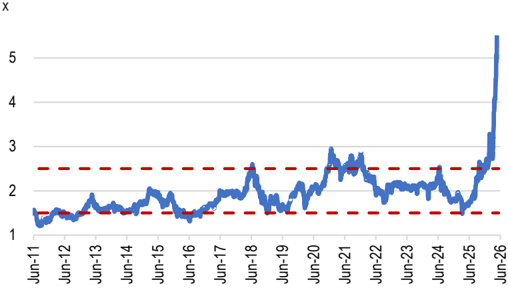
Source: Bloomberg Finance L.P. Note: Past performance is not an indicator of future results.
Figure 27: Murata market cap vs revenue trend
Yen bn, Yen mn
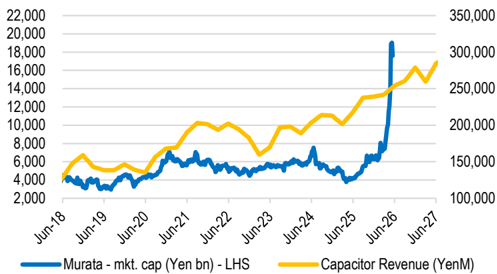
Source: J.P. Morgan estimates, Company data, Bloomberg Finance L.P.
MLCC Players Market Cap vs. MLCC Revenue
Figure 24: MLCC industry combined revenue vs. market cap trend
Source: J.P. Morgan estimates, Company data.
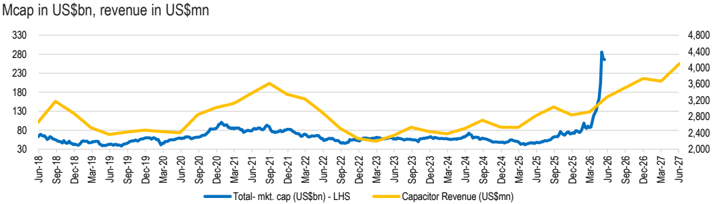
Figure 25: MLCC industry combined OP vs market cap trend
Mcap in US$bn, OP in US$mn
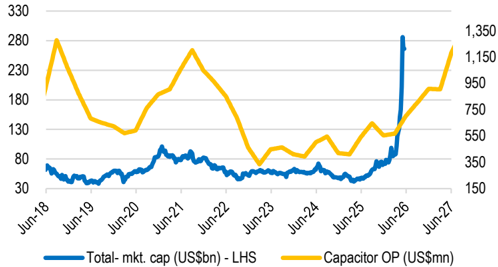
Source: J.P. Morgan estimates, company data, Bloomberg Finance L.P.
Figure 26: MLCC industry combined OPM vs market cap trend
Mcap in US$bn, % - RHS
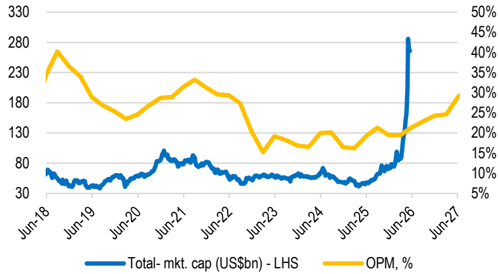
Source: J.P. Morgan estimates, company data, Bloomberg Finance L.P.
MLCC players market cap vs MLCC revenue
Figure 28: Taiyo Yuden market cap vs revenue trend
Yen bn, Yen mn
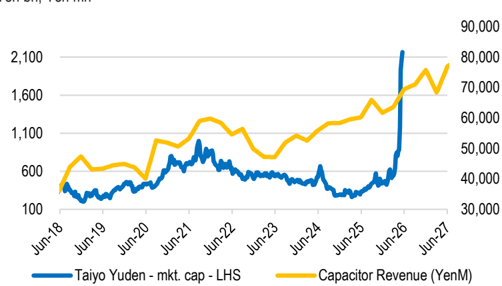
Source: J.P. Morgan estimates, Company data, Bloomberg Finance L.P.
Figure 29: SEMCO market cap vs revenue trend
Wbn, Wbn
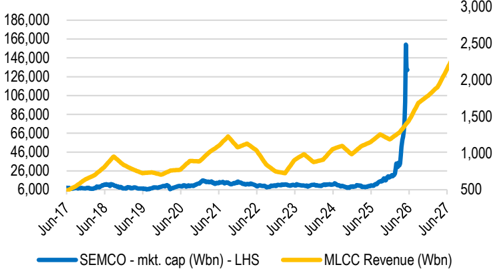
Source: J.P. Morgan estimates, Company data, Bloomberg Finance L.P.
Figure 30: Yageo market cap vs revenue trend
NT$bn, NT$mn
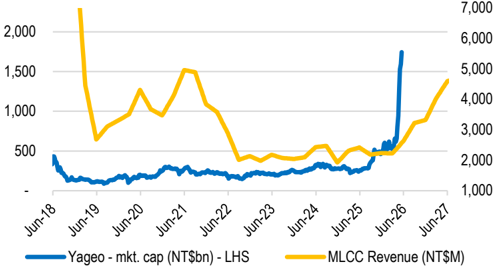
Source: J.P. Morgan estimates, Company data, Bloomberg Finance L.P.
MLCC players' market cap vs MLCC OP
Figure 31: Murata market cap vs MLCC OP trend
Yen bn, Yen mn
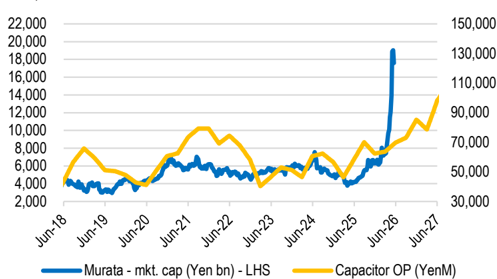
Source: J.P. Morgan estimates, Company data, Bloomberg Finance L.P.
Figure 33: SEMCO market cap vs MLCC OP trend
Wbn, Wbn
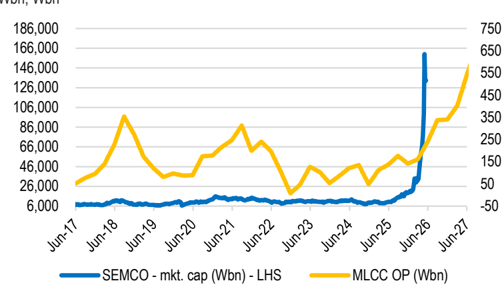
Source: J.P. Morgan estimates, Company data, Bloomberg Finance L.P.
Figure 32: Taiyo Yuden market cap vs MLCC OP trend
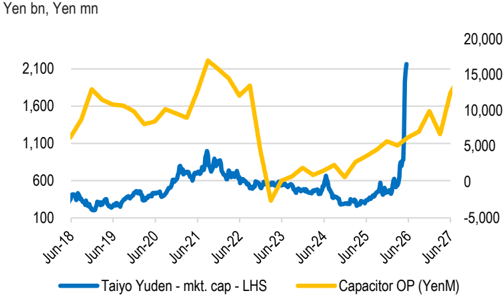
Source: J.P. Morgan estimates, Company data, Bloomberg Finance L.P.
Figure 34: Yageo market cap vs MLCC OP trend NT$bn, NT$mn
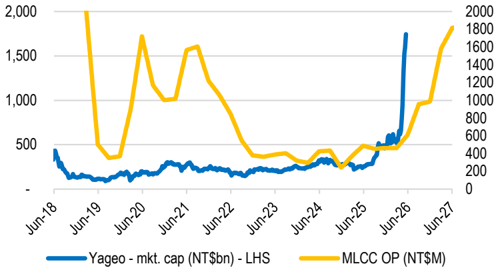
Source: J.P. Morgan estimates, Company data, Bloomberg Finance L.P.
MLCC players' market cap vs MLCC OPM
Figure 35: Murata market cap vs MLCC OPM trend
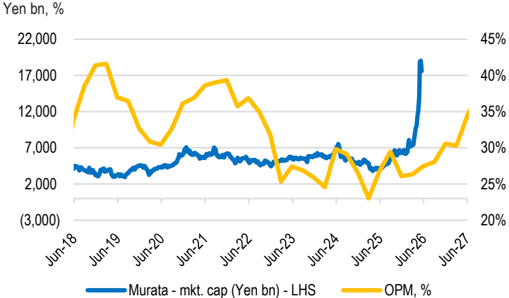
Source: J.P. Morgan estimates, Company data, Bloomberg Finance L.P.
Figure 36: Taiyo Yuden market cap vs MLCC OPM trend Yen bn, %
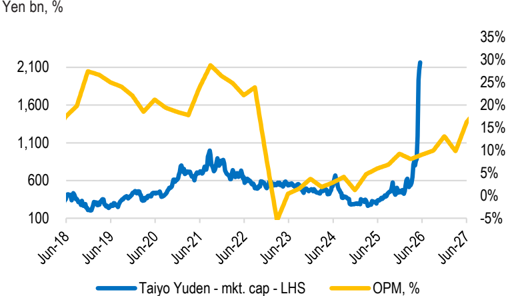
Source: J.P. Morgan estimates, Company data, Bloomberg Finance L.P.
Figure 37: SEMCO market cap vs MLCC OPM trend
Wbn, %
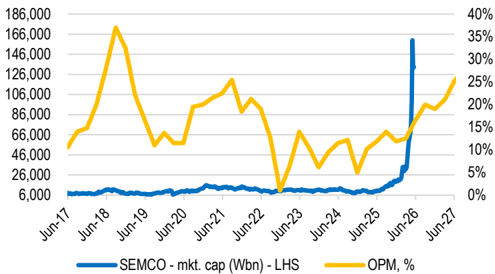
Source: J.P. Morgan estimates, Company data, Bloomberg Finance L.P.
Figure 38: Yageo market cap vs MLCC OPM trend
NT$bn, %
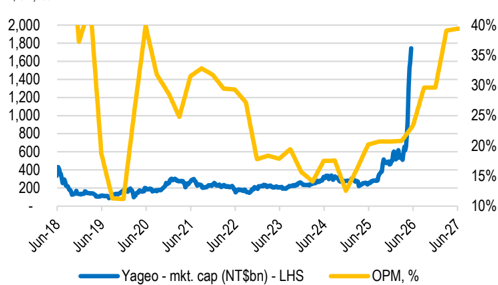
Source: J.P. Morgan estimates, Company data, Bloomberg Finance L.P.
Companies Discussed in This Report (all prices in this report as of market close on 12 June 2026, unless otherwise indicated) Murata Manufacturing (6981)(6981.T/¥8,556/OW), Samsung Electro-Mechanics(009150.KS/W1,704,000/OW), TDK (6762) (6762.T/¥3,504/OW), Taiyo Yuden (6976)(6976.T/¥15,725/OW), YAGEO(2327.TW/NT$855.00/OW)
Analyst Certification: The Research Analyst(s) denoted by an 'AC' on the cover of this report certifies (or, where multiple Research Analysts are primarily responsible for this report, the Research Analyst denoted by an 'AC' on the cover or within the document individually certifies, with respect to each security or issuer that the Research Analyst covers in this research) that: (1) all of the views expressed in this report accurately reflect the Research Analyst's personal views about any and all of the subject securities or issuers; and (2) no part of any of the Research Analyst's compensation was, is, or will be directly or indirectly related to the specific recommendations or views expressed by the Research Analyst(s) in this report. For all Korea-based Research Analysts listed on the front cover, if applicable, they also certify, as per KOFIA requirements, that the Research Analyst's analysis was made in good faith and that the views reflect the Research Analyst's own opinion, without undue influence or intervention.
All authors named within this report are Research Analysts who produce independent research unless otherwise specified. In Europe, Sector Specialists (Sales and Trading) may be shown on this report as contacts but are not authors of the report or part of the Research Department.
圖片清單(已驗證 2026-07-02)
回補驗證:僅涵蓋已被 lib 頁嵌入的圖片,非全量驗證。
| 檔名 | size | 分類 | 親眼所見內容 |
|---|---|---|---|
20260612_JPM_Asian MLCC Industry_001.png |
59KB | 真資料圖 | 長條圖疊加折線,MLCC industry revenue(top-down)與 y-y changes % [RHS],2016-2028E |
20260612_JPM_Asian MLCC Industry_009.png |
66KB | 真資料圖 | 長條圖疊加折線,Procurement/Supply 與 Gap (%) [RHS]、16-25 average Gap (%) 水平線,2016-2028E |